Closing a price gap: a beginner's guide
The same futures contract trades at different prices on different exchanges. This guide covers how to read that gap in SpreadLabs, how to tell a gap you can close from one you can't, and where the platform itself tells you how long you would have to hold the position.
What is price spread arbitrage
A price spread is the difference in price of the same perpetual contract on two exchanges. A perpetual contract (perp) is a futures contract with no expiry date: you can hold it for as long as you like.
The setup: long on the exchange with the lower price, short on the exchange with the higher price, both legs the same size. A leg is one of the trade's two halves, that is, the position on one exchange. A pair like this is called delta-neutral: if the token rises, the long gains exactly as much as the short loses, and vice versa. So the position doesn't depend on where the token goes. It depends on whether the two prices converge again.
The outcome isn't decided by the gap you see on the screen. You have to cross the spread twice: once when you open both legs, and again when you close them. SpreadLabs quotes both crossings separately.
| Column | What it quotes |
|---|---|
Entry Spread | The gap you cross when opening the position |
Exit Spread | The gap you cross when closing it |
Execution | Entry Spread plus Exit Spread: the full round trip |
All three are quoted at the order size set in Depth, not at some abstract average price. The sign tells you which way the gap points. A positive Entry Spread means the gap works in favor of the opening trade: the short leg is quoted higher than the long leg, so you sell higher than you buy. A negative one means you pay to enter. Exit Spread reads the same way, but for the closing trade, and Execution is their signed sum.
The other half of the arithmetic is funding. It's a periodic payment between long and short holders that the exchange debits and credits on a schedule: every hour or every eight hours, depending on the exchange. While the position is open, the two legs pay and receive funding, and it's this carry that can cover Execution over time.
Carry is what a position earns just for being open: not from price movement but from time passing, interval by interval, like rent. In a price trade, it isn't the source of the result but what pays for waiting for convergence.
So the question to ask of a candidate isn't “how wide is the gap” but “does anything pay for crossing it twice, and how long will that take”. The rest of this guide walks that question through the interface.
A pair you should not open
The numbers are illustrative, captured on 2 Sep 2026. The market has moved on since then; the way to read these numbers hasn't.
RED, long Variational, short Bybit, as seen on Pair Analysis:
| Card | Value |
|---|---|
Funding spread | +0.00% |
Entry · top of book | -0.446% |
Exit · top of book | -0.342% |
Round-trip cost | -0.787% |
The pair looks like an opportunity: two exchanges, two different prices, a visible gap. The four cards say otherwise. A full round trip costs 0.787% before a single exchange fee, and Funding spread is zero, so holding the position pays nothing toward that cost. No holding period fixes this pair, because there is nothing to accumulate.
The liquidity gap settles the question. Volume 24h is how much money went through the instrument in a day, that is, a measure of how easy it is to get in and out. Here it was $1.1M on the Bybit leg versus $10K on the Variational leg: the long leg was 110 times thinner than the short. A size that fits on one side doesn't fit on the other, and it's the thin side that will have to absorb the exit.
Passing on a pair is a normal outcome, not a failure. The guide starts here because the costly mistake in this strategy isn't a missed spread but a position that opened cleanly and couldn't close.
Before you start
This guide describes what the platform shows and what the mechanics cost. Nothing here is a recommendation to open a position.
Exchanges. Funded accounts on both exchanges of the pair, the same instrument traded on both, and enough margin on each side to hold both legs through the move. Margin is the collateral the exchange holds against a position; if it runs out, the position is closed for you. Open the legs close together in time: the gap between the first and the second fill is time during which you have one leg open without the other, which is an ordinary directional bet on price.
Numbers. Your own fee tier on both exchanges. Everything SpreadLabs quotes is gross, that is, before deductions: Entry Spread, Exit Spread, Execution and Δ APR are given before exchange fees and before your own slippage. Slippage is the difference between the price you saw and the price your order actually filled at. A full round trip is four fills: open the long, open the short, close the long, close the short, and each one is charged at your maker or taker rate. Maker is when you place an order and wait; taker is when you take someone else's order immediately. The latter is usually more expensive.
Time. Moving margin between exchanges takes exactly as long as a deposit and a withdrawal. A position that needs a margin top-up mid-trade is limited by transfer time, not by the chart.
What the platform doesn't do.
| Not provided | What it means here |
|---|---|
| Trade execution (for now) | You carry out every step below yourself, in the exchanges' terminals |
| Exchange API keys | Not requested or stored: the platform reads public market data |
| Fee calculator | You add fees yourself, on top of every quoted number |
| Public API | In development, planned for Max |
What Pro unlocks on the pages used here. On Live Spreads: Depth, Filters, Columns, Exchanges and custom KPI cards; free access also shows only the top rows of the list and refreshes less often. On Pair Analysis: DEPTH, finer chart resolutions, history beyond the most recent window, and Spread distribution. Because Entry Spread and Exit Spread are quoted at the Depth size, both columns show a dash while Depth is unavailable.
Step 1: Find a candidate on Live Spreads
Live Spreads ranks all tracked pairs in a single list, in descending order. The goal of this step is to get from roughly seven thousand rows down to the few you can actually work with, and to do it in an order that doesn't waste effort.
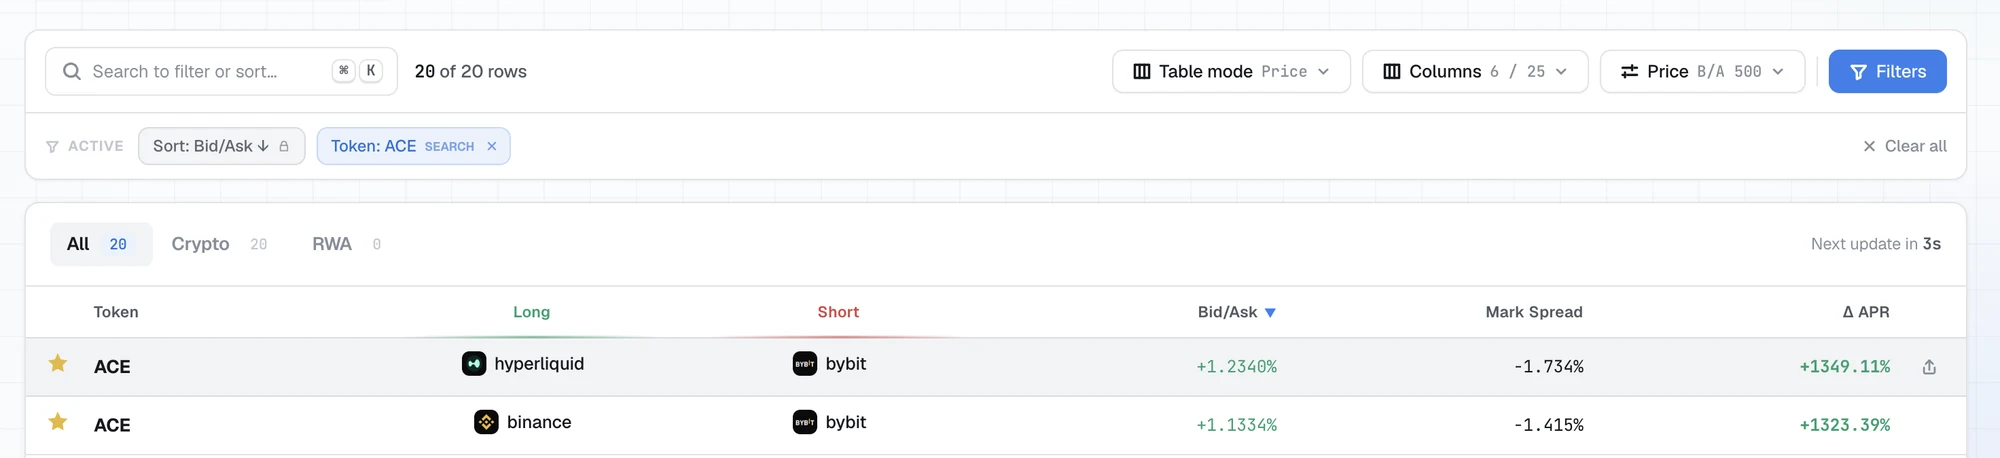
Switch the table to the price layout. Table mode → Price narrows the table to 6 of 27 columns and changes the sort to Entry Spread. The sort change is the whole point of the preset: the list is now ranked by the gap you cross when opening, not by funding.
Add the payback columns. The preset is a starting point, not a limit. Open Columns and add Exit Spread, Execution, Break Even, Intervals to B/E, OI Sum, Volume Sum and Spread %ile. Without them, the table quotes the entry and says nothing about the exit, or about what pays for either. You can drag the columns into whatever order is easiest to read.
Set Depth before comparing anything. Depth (labeled Spread depth when open) sets the trade size at which spreads are quoted, from $500 · tightest · top of book to $50,000 · deep · most slippage. The point is that a small order takes only the best price in the order book, while a large one also has to eat through the worse prices behind it. Entry Spread, Exit Spread and Execution change along with Depth, and so does the order of the rows. The row that looks best at $500 isn't necessarily the row that looks best at the size you can actually execute.
Narrow the list. Exchanges first: pick one exchange to see every pair with a leg on it, or two or more to see only pairs between the selected exchanges. Limiting the list to exchanges where you have funded accounts removes most of the table at once, and for a reason that won't change tomorrow.
Then Filters, the numeric ranges. Four of the five fields matter here.
| Field | Presets | What it removes |
|---|---|---|
Price Spread | ≥ 0.5 · ≥ 1 | Gaps too narrow to survive a full round trip |
OI Sum | ≥ 100K · ≥ 1M · ≥ 10M | Pairs with no open interest behind them |
Volume Sum | ≥ 1M · ≥ 10M · ≥ 100M | Pairs that trade too rarely to exit |
OI Diff | ≤ 5000% · ≤ 50000% | Pairs where one leg is much thinner than the other |
Open interest (OI) is how much money is currently sitting in open positions on the instrument. Unlike volume, it shows not turnover but the size of the positions already built up.
Watch the direction: OI Diff presets are a ceiling, while all the others are a floor. It's also worth knowing that presets aren't the only way to set a bound: each field has two inputs, min and max, and you can type an upper bound into the second one by hand. Active filters appear as chips below the toolbar, with their count in the footer; Reset clears them all.
Read the remaining rows in this order.
| What you read | The question it answers |
|---|---|
Entry Spread | What does it cost to open? |
Exit Spread | What does it cost to close? |
Execution | What does the full round trip cost? |
Break Even | How long until the funding carry covers it? |
Intervals to B/E | The same answer, in this pair's funding intervals |
OI Sum, Volume Sum | Is there enough volume behind the pair to hold the size you need? |
OI Diff, Volume Diff | Is liquidity spread evenly, or is one leg a bottleneck? |
Spread %ile | Is the gap wide for this pair, or is it normal for it? |
Execution is exactly the arithmetic set out in the first section: Entry Spread plus Exit Spread, and you can see it in the table without any calculation.
A dash in Break Even is an answer, not missing data. It means the funding carry doesn't cover Execution over any holding period. The pair can still converge on price alone, but while you wait, nothing accumulates, and the entire result has to come from the gap closing.
Every column header has a tooltip. Hovering over it is faster than leaving the page to look up a definition.
Step 2: Analyze the pair on Pair Analysis
A row on Live Spreads is a position in a ranking. Pair Analysis is where you analyze the pair properly, and it's the last page before any order.
Clicking a row opens the pair already filled in, with the token, the long leg and the short leg set. You can also build the same view by hand: 1 Long exchange, 2 Short exchange, 3 Token. DEPTH sets the quoting size here exactly as on Live Spreads, and the control between the two exchange selectors swaps the legs.
Start with the four cost cards. The whole take-it-or-leave-it decision sits in one row.
| Card | What you take from it |
|---|---|
Funding spread | Annualized carry between the legs: how much holding pays, or how much it costs |
Entry · top of book | What it costs to open at the top of the book (best price) |
Exit · top of book | What it costs to close at the top of the book (best price) |
Round-trip cost | Entry plus exit: the full cost of the trade |
The order book is the list of all buy and sell orders on an instrument. The top of the book (top of book) is the best order on each side: the highest price someone is willing to buy at and the lowest price someone is willing to sell at. The prices on these cards come from there, so they're the most optimistic possible.
Read Round-trip cost together with Funding spread before anything else on the page. One is what the trade costs to execute, the other is the cost of holding it. The RED pair from the first section fails right here: a round trip of -0.829% against a Funding spread of +0.00%.
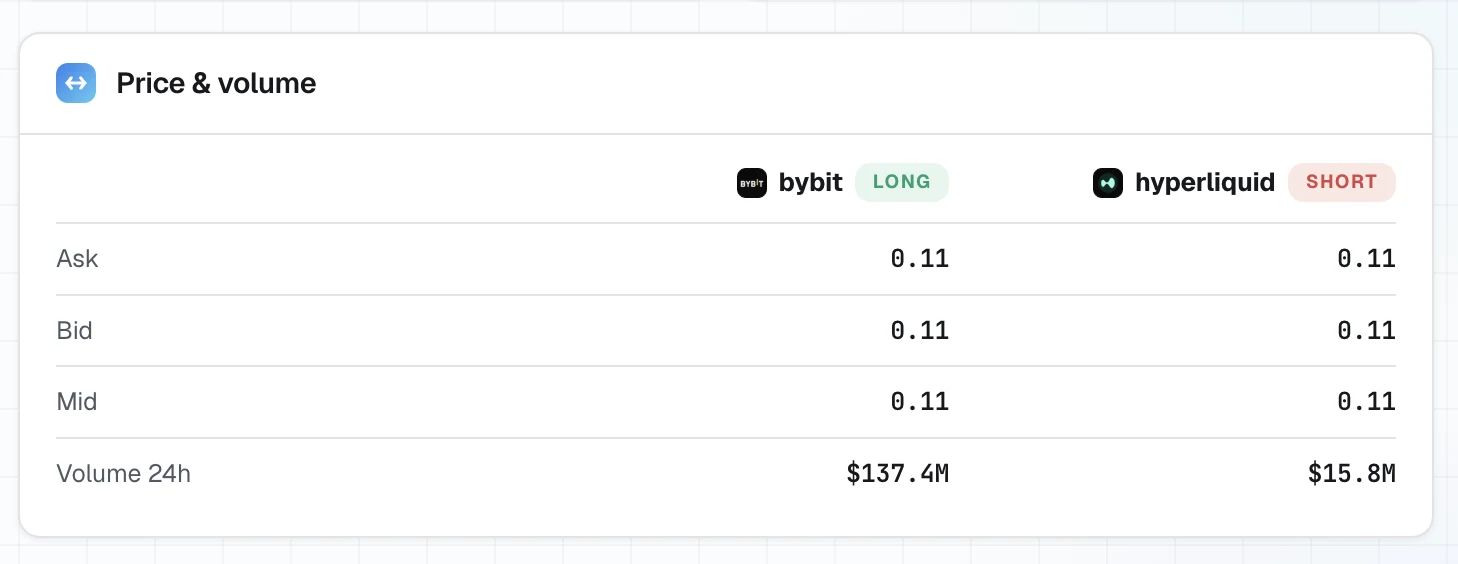
Next, check whether the size fits. Price & volume shows Ask, Bid, Open interest and Volume 24h for each leg. A large gap between the legs on any of these metrics is a size limit set by the smaller of the two. And the smaller side is also the one that will have to absorb the exit, at a time when the exit may not be voluntary.
Next, check what the size costs. The Price spread chart plots four series: Entry · top and Exit · top at the top of the book, and Entry eff · $1k and Exit eff · $1k, the same two adjusted for order book depth at the selected size. “Adjusted for depth” means this: a $1,000 order doesn't fit into the single best order, so it eats through several in a row, and the average price ends up worse than the top of the book. The gap between the solid and the dashed lines is the price of size on this pair. If it's wide, the numbers on the cost cards aren't the numbers that will fill.
Next, check whether the level is unusual. Spread distribution plots a histogram of the entry spread over a 7d or 30d window, with a marker at the current value. A histogram is a bar chart: spread levels on the horizontal axis, and how often each level occurred on the vertical axis. It answers one question: is the gap on the screen normal for this pair, or is it an outlier? A spread at its usual level has less room to narrow than a spread at the edge of its own distribution. Spread %ile on Live Spreads says the same thing in a single number. The two should agree; if they don't, check that both pages have the same Depth set.
Save the link. Share copies a URL with the token and both legs, so the pasted link opens the exact same view: spreadlabs.io/pair-analysis?token=SKR&long=binance&short=bybit is the pair this guide follows. Pasting a link like this into your trade journal is the cheapest possible record of what was on the screen at the moment of the decision.
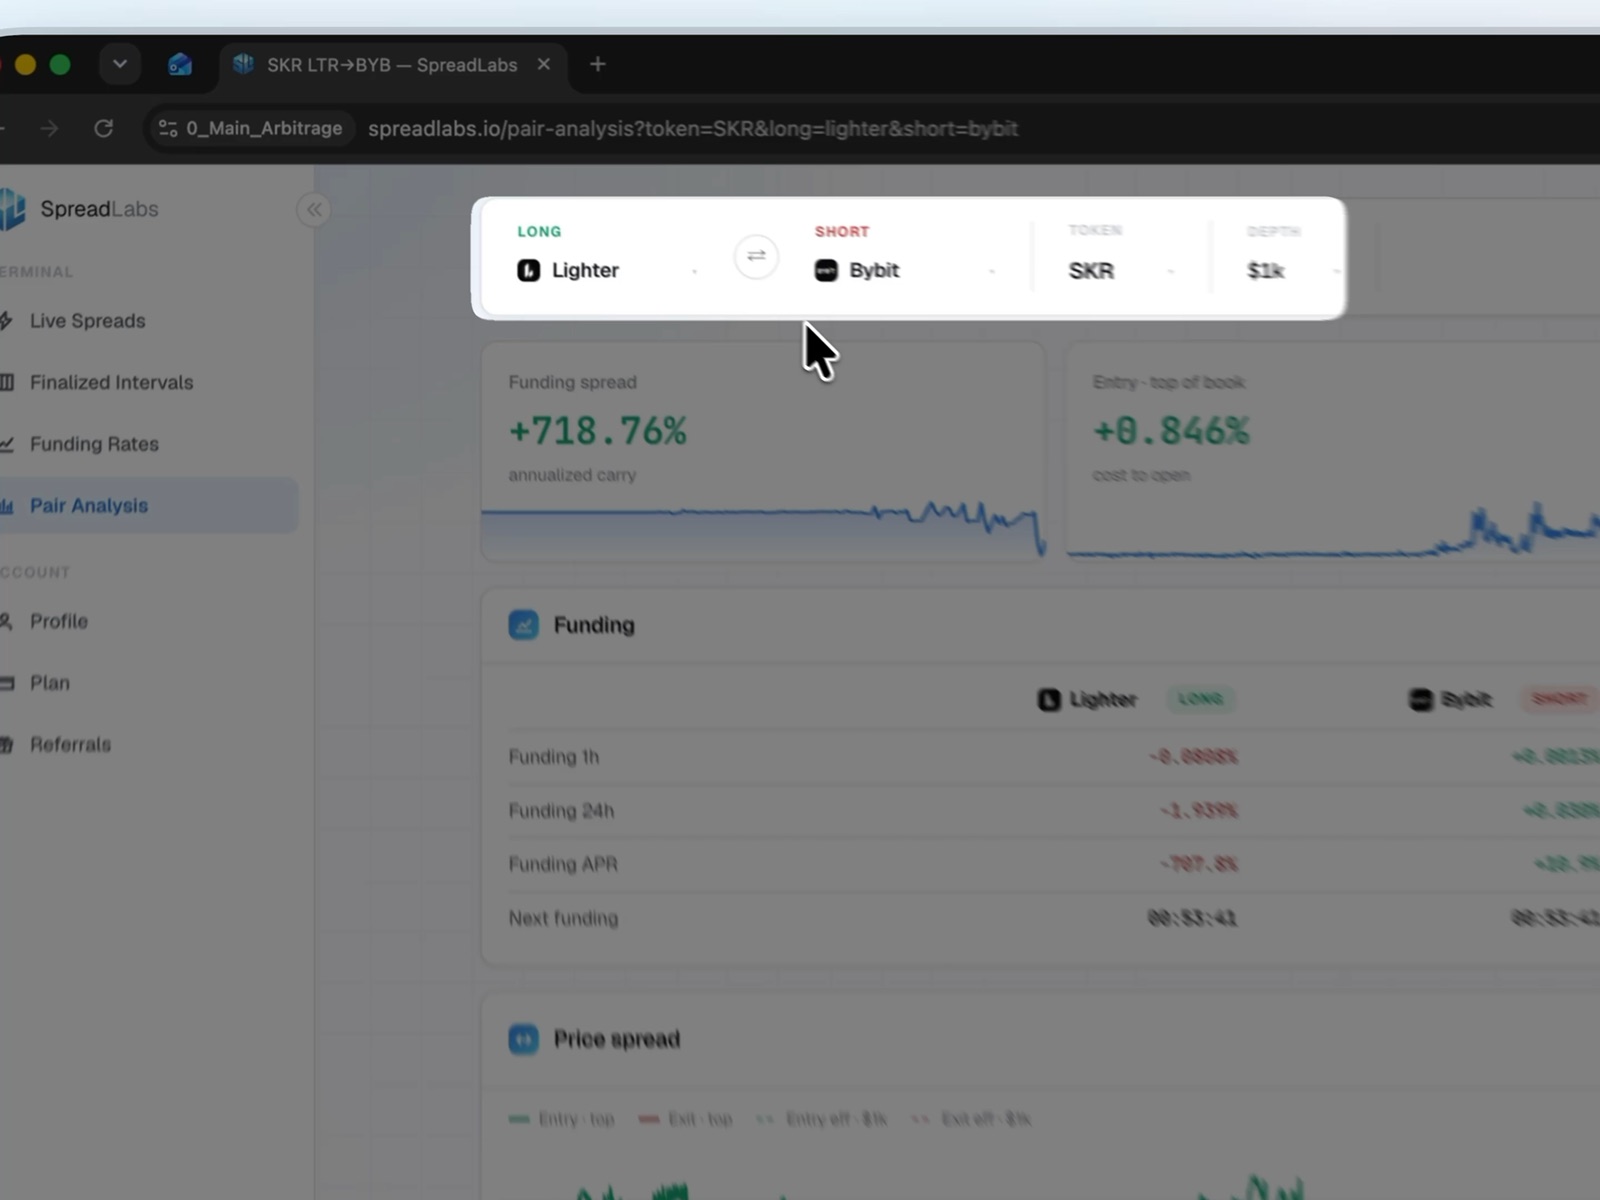
Pair header: both legs, the token and the depth at which spreads are quoted
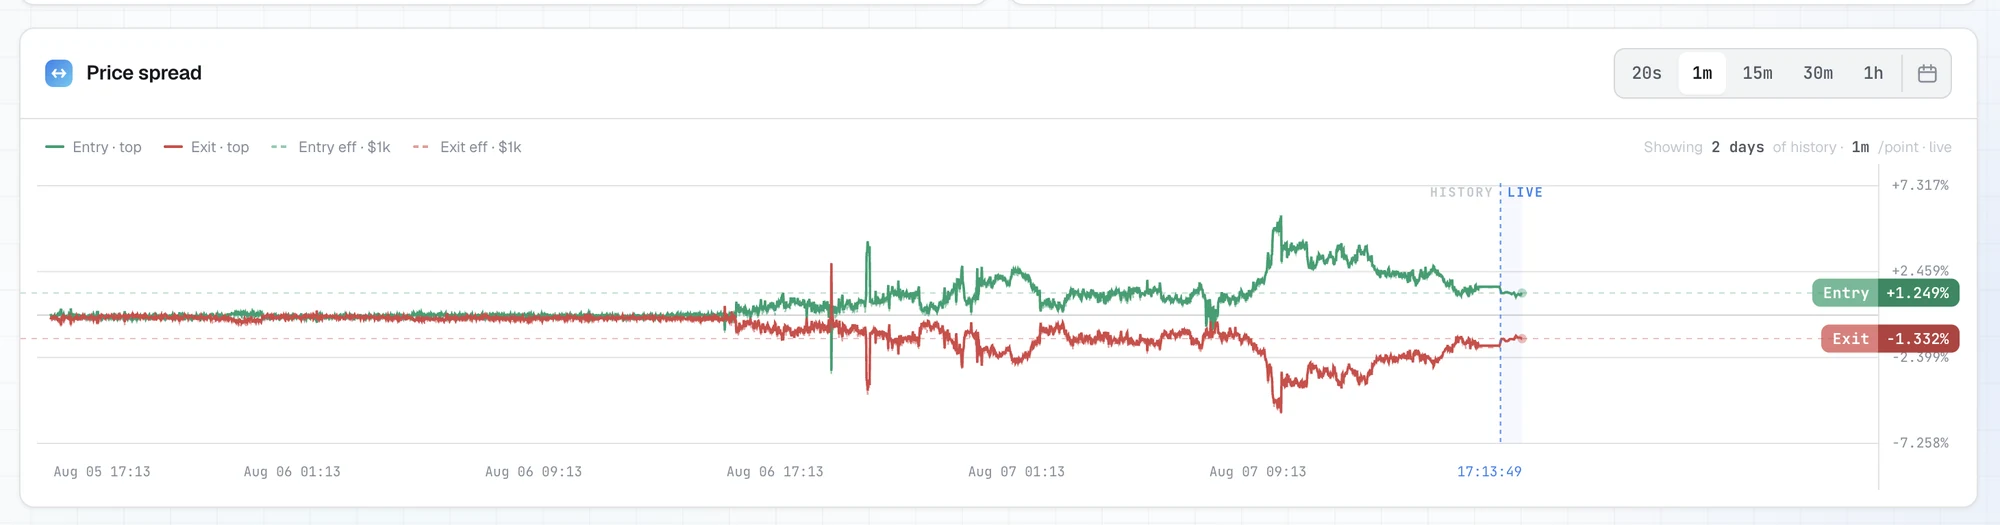
Top of book vs. effective: the gap between them is the price of size
What makes a candidate fail this page:
Round-trip costis higher than what the carry can cover;Funding spreadis at zero and you have no convergence thesis;- a leg's
Volume 24hcan't accommodate the size you need; - there's a wide gap between the top-of-book and the effective spreads;
- the current level sits in the middle of the distribution, with nothing to set it apart.
Any one of these is enough to move on to the next row. There's no shortage of rows.
Step 3: Size the trade to the depth
A spread isn't a number but a function of size. Put simply: the bigger the amount, the worse the price at which you actually get in. Everything you've read so far (Entry Spread, Exit Spread, Execution and the cost cards on Pair Analysis) is quoted at the value set in Depth. So sizing doesn't come after the analysis: it's an input that determines whether the analysis applies at all.
Set the depth to the size you actually plan to trade and re-read the pair. The Price spread chart shows the difference directly: Entry · top and Exit · top are the top-of-book lines, while Entry eff · $1k and Exit eff · $1k are the same spreads adjusted for order book depth at that size. The distance between the solid and the dashed lines is the price of size on this pair, and it differs from pair to pair.
Hedge quantity, not dollars. A hedge is a second position that offsets the risk of the first. Here it's delta-neutral on the underlying asset, so both legs must hold the same number of contracts, not the same dollar amount. The dollar notionals then come out slightly different, and that difference is the price gap itself, expressed in money.
The SKR position shows what happens when you match dollars instead of quantity. Both legs were opened at roughly the same notional, and the coin counts diverged:
| Leg | Quantity | Fill price | Notional |
|---|---|---|---|
Long Binance | 12,683 SKR | 0.0235737 | $298.99 |
Short Bybit | 12,610 SKR | 0.023785 | $299.93 |
| Difference | 73 SKR | – | $0.94 |
Matching by dollars brought the notionals within a dollar of each other and left 73 more coins in the long than in the short: 0.58% of the position carrying direction rather than spread. Those 73 coins aren't hedged at all: they behave like an ordinary bet on the price going up. The token then moved -6.23%, and this unhedged remainder cost $0.11 against a spread result of $0.69 on the hedged part. The trade still worked. What matters is something else: this leak doesn't come from bad luck but from the way the position was built, and it grows with the position's size.
On the matched 12,610 coins, the entry gap was worth $2.66. That's the number the spread trade actually works with.
The thin leg sets the ceiling. A size that goes through on the deeper exchange still has to be closed on the shallower one, and you don't always get to choose when you exit. Compare two pairs that went through this guide:
| Pair | Volume 24h long / short | Ratio | Takeaway |
|---|---|---|---|
SKR Binance/Bybit | $354.5M / $85.6M | 4.1× | Both sides can take a ~$300 leg |
RED Bybit/Whitebit | $681M / $801K | 850× | The short leg won't absorb the exit |
Open interest says the same thing, but on a slower clock: SKR had $13.6M versus $8.5M, a gap of the same order as the volume gap, not a different one.
Leverage sets the buffer, not the size. Leverage is how many times larger the position is than the collateral behind it. On SKR, each leg ran at a nominal 10x leverage, which tied up about $30 of the $100 deposit on each exchange as margin and left about 70% as free balance. The effective exposure relative to each deposit came out at about 3x, not 10x. The free balance isn't idle capital: it's what absorbs a move against the position while both legs are open.
Cross and isolated margin behave differently here, and the difference is large. With isolated margin, only the allocated amount is locked against the position, and you can't lose more than that. With cross margin, the entire exchange balance backs the position: liquidation comes later, but the loss is measured against the whole account. The long leg of SKR closed with an ROI of -49.24%, while the pair as a whole returned +1.5%. On cross margin, that leg was backed by the entire exchange balance, so the token's -6.23% move ate 14.75% of the Binance balance. On isolated margin of the same size, the same move eats about half of the position's margin, which is exactly what the -49.24% figure measures.
This has two consequences, and being hedged cancels neither of them. The drawdown lives on one exchange and the profit offsetting it lives on the other, and neither automatically supports the other. Moving margin between them takes as long as a withdrawal and a deposit, and that's longer than the move takes.
Size and holding period are one decision. Break Even tells you how long it takes the carry to cover Execution, and Execution changes with Depth. A larger size widens the spreads, which lengthens the payback, which changes how long the position has to survive. For SKR, read about three hours before opening at $1k depth, Round-trip cost was -0.043% against a Funding spread of +805.15%: a payback of about 28 minutes, one funding interval on two exchanges with hourly funding. The position was held for 11 hours 43 minutes, roughly 25 of its own payback periods. The following sections spend this safety margin.
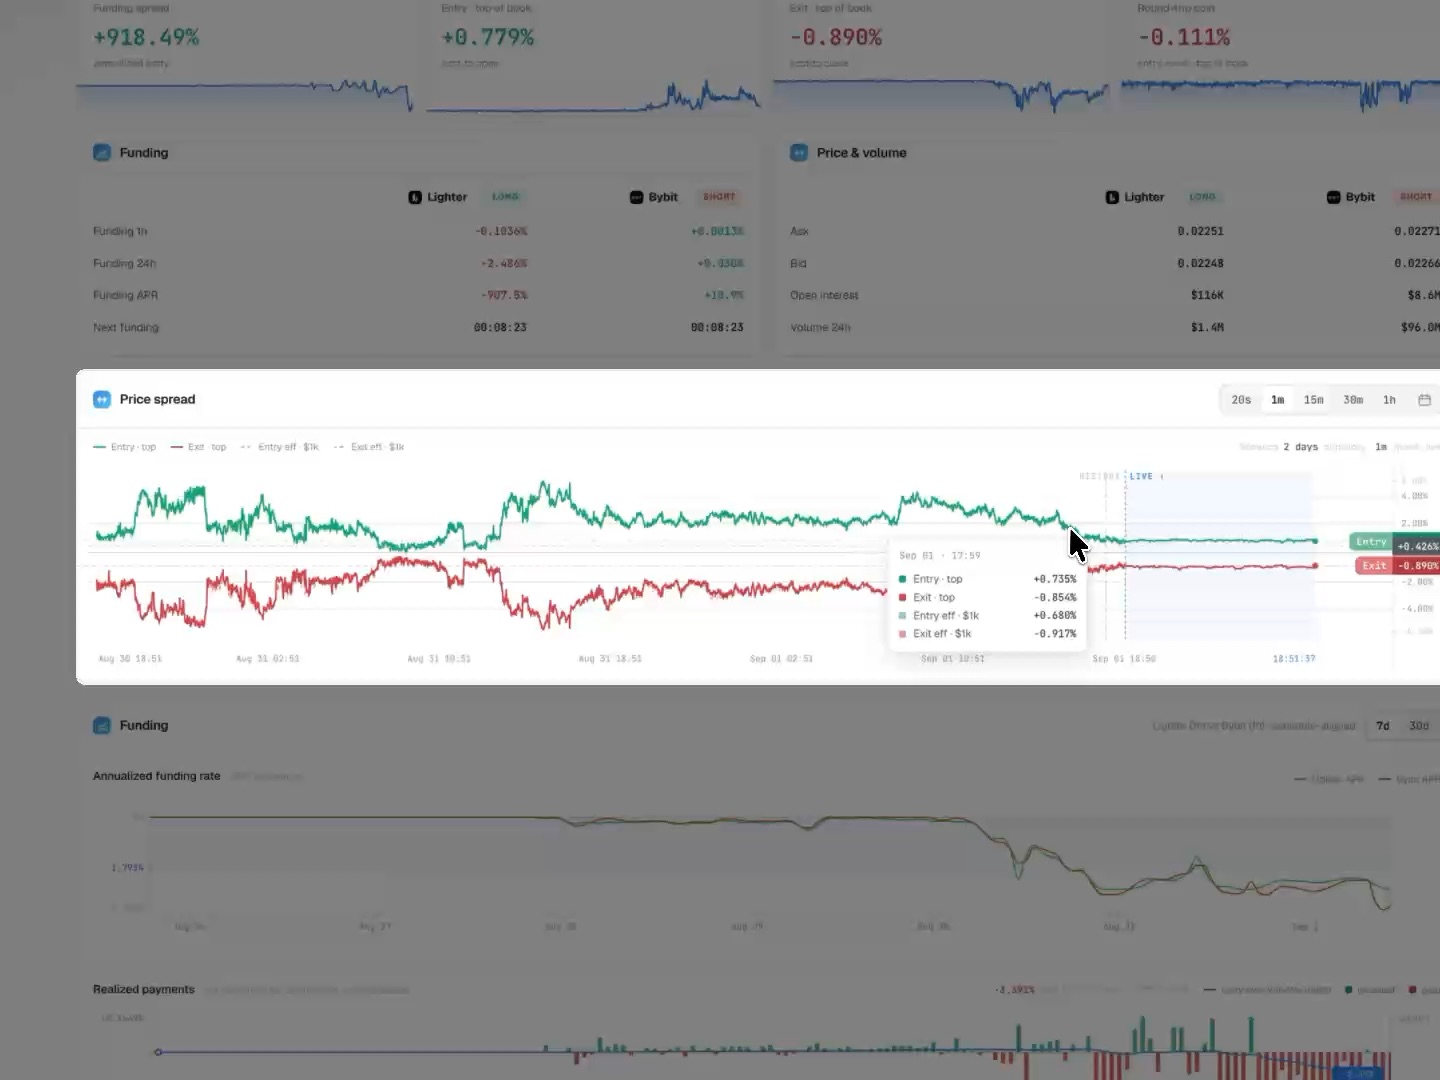
The distance between the solid and the dashed lines is the price of size on this pair
Step 4: Open both legs
You open both legs by hand, in two exchange terminals. At this stage, SpreadLabs doesn't let you open or close a position directly from the site. Everything from here on happens outside the platform.
Once you've picked a pair to work with, you need to prepare liquidity to enter the position. The video below shows one possible way to do it.
Open both sides as close together in time as possible. The gap between the first and the second fill is time spent with one directional leg and no hedge against it. That exposure has nothing to do with the spread you're trading and can easily be larger than it.
Get to the terminals from the row. The exchange cell in the Long and Short columns links straight to the right instrument on that exchange, so both terminals open from a single row instead of being looked up separately.
Order type is a choice between two costs, not a best practice. A market order fills immediately at whatever price is in the order book; a limit order waits for your price and may not fill at all. Market orders on both sides cross the quoted spread and put the hedge on immediately. Limit orders on both sides let you avoid crossing it, but a fill on one side without a fill on the other leaves exactly the unhedged leg described above. One option pays the spread, the other risks the hedge.
The short leg of SKR was opened with a limit order that filled at a 0.036% fee rate, and the two legs' fills were 28 seconds apart: 00:26:13 on Bybit versus 00:26:41 on Binance. Twenty-eight seconds is a short unhedged window, but not zero, and on a fast-moving token it's exactly the window that decides whether the quoted entry gap matches the one that fills.
Check the funding clocks before you execute. Next Funding Long and Next Funding Short on Live Spreads, or the Next funding row on Pair Analysis, count down to the next payment on each exchange. Where carry is the case for the trade, the position has to stay open through these payments to collect any of it. For SKR, both exchanges ran on hourly funding, the schedules were aligned, and when the pair was read there were 35 minutes left until the next payment.
Expect the fill to differ from the quote. Quoted spreads are the live top of the book at the selected depth at the moment you read them; execution happens later, against whatever order book is there at that point. For SKR, the platform quoted Entry · top of book at +0.879% at $1k depth; the position filled at 0.0235737 on Binance versus 0.023785 on Bybit, so the entry gap came to +0.896%, 0.017 percentage points better than the three-hour-old quote. It could just as easily have gone the other way.
Record the position at the moment of execution, not later. Half of what a completed trade needs for its own accounting is visible only while it's being opened:
- The exact fill time of each leg, in UTC
- Exchange, side, quantity and average fill price for each leg
- The
Depthvalue at which you read the pair, and the four cost cards as they read when you made the decision Break EvenandIntervals to B/Efrom the row- Each exchange's funding interval and the time of its next payment
- The
Sharelink, which encodes the token and both legs in a single URL
The Trade journal section turns this list into a journal format and fills it in with the completed SKR trade.
Check before you step away. Both legs are live, their quantities match, their directions are opposite, and the margin on each exchange is enough to withstand a move against whichever leg it goes against.
Step 5: Set your exit level before you need it
The exit is the second crossing of the spread, and the platform calculates it from the very start: Exit Spread on Live Spreads, Exit · top of book on Pair Analysis. The values are live and change, but their order of magnitude is known before you enter. So the exit level is an entry decision, not an exit decision.
Three numbers set it, and you read all three on pages you've already been through.
Where the spread usually returns. Spread distribution plots a histogram of the entry spread with a marker at the current value, and Spread %ile says the same thing in a single number. A spread at the edge of its own distribution has somewhere to return to; a spread in the middle has almost nowhere. This is a guide to convergence, not a promise of it.
When the position stops costing money. Break Even and Intervals to B/E give the time it takes the carry to cover Execution. Before that point, closing locks in the round-trip cost with nothing covering it; after it, the question changes from “what does it cost to get out” to “how much more does holding pay”. For SKR, the quoted Break Even was about 28 minutes (one funding interval), and the position lasted about 25 such periods.
A caveat without which this number is misleading: Execution is gross, that is, before fees. The fees for the four fills come on top. On SKR they came to $0.68, or 0.227% of the leg notional, and the carry took about 2 hours 50 minutes to earn them back: six times longer than the quoted 28 minutes. Add your own fee level to Break Even before you enter, not after you close.
What breaks the thesis. A trade rests on carry, on convergence, or on both; the risk exit comes when that basis disappears.
| Signal | Where you see it | What it means |
|---|---|---|
Funding spread collapsed or flipped sign | Pair Analysis, card | Holding stopped paying |
| The rate flipped on one leg | Funding panel, Funding APR per leg | One leg now pays instead of receiving |
Volume 24h dropped on the thin leg | Price & volume | The exit costs more than you calculated |
Spread %ile hit a new extreme | Live Spreads | The spread is diverging, not converging |
| Margin is melting on the losing leg | Exchange terminal | An account constraint, not a thesis one |
A rate flip isn't a hypothetical scenario. On SKR, the short leg on Bybit was quoted as receiving before entry (Funding APR +10.9%), but it went negative during the hold and paid $1.39. The pair still closed in profit, but only because the long leg outperformed its quote and the Break Even margin was 25-fold. The thesis changed inside the trade, and the only place to notice it was the Funding panel.
The live Price spread chart on Pair Analysis shows both levels in real time: the Entry and Exit labels on the axis move with the order book, and they show whether the spread is approaching your recorded exit level or moving away from it.
Before you enter, write down three numbers: the target Exit Spread level, the holding period from Break Even with your own fees added, and the risk exit condition. Written down, they're a plan. Recalled in the moment, they're an opinion.
And finally: the exit isn't always voluntary. Margin on the losing leg, a delisting of the instrument (the exchange removes it from trading), a withdrawal halt on an exchange: all of these close the position for you, at whatever prices are available at that moment.
Step 6: Close the position
Closing is the same round trip in reverse: two legs, by hand, the same quantity, as close together in time as possible. There's one difference: now you're crossing Exit Spread, which you could see from the very start.
Close both legs, not one. A closed leg with the other one still live isn't half a position; it's a full-size directional position. That's how you exit a delta-neutral setup straight into exactly the exposure it was built to avoid.
Order type costs money again, and on the exit it costs more. On SKR, the short leg was opened with a limit order at a 0.036% fee rate and closed with a market order at 0.1%: by rate, the exit cost three times as much as the entry. That's the price of immediacy, and it's known in advance.
You can see the order book in how your order fills. The market close of 12,610 SKR on Bybit went through in four fills (570, 3,890, 4,260 and 3,890 coins) at prices from 0.022263 to 0.022259. The spread between the best and the worst was 0.018%: the book absorbed $280.71 with practically no slippage. This confirms the liquidity check from step 3: Volume 24h of $85.6M on the short leg promised exactly this kind of exit.
Splitting into several fills is normal market order behavior, not a glitch: the order simply takes several orders from the book in a row. Don't look at the number of fills but at the price spread between them: that's your actual slippage, the same slippage Depth estimated in advance.
Right after closing, record four things while they're still available: each leg's close time, each leg's average fill price, each leg's closing fee and, separately, each account's balance. The last one matters more than the other three: the closed-position card and the account statement give different numbers, and you'll only find that out during reconciliation.
Check what's closed. Both positions are at zero, no open orders are left, and no remainder from a partial fill is sitting on either exchange. An unnoticed remainder is an open directional position, and it doesn't stop being one just because the trade is considered closed.
After closing: what the trade actually returned
The position is closed, and your two accounts hold two new balances. Now comes the work the platform doesn't do for you: combine the fills, funding and fees from two exchanges into one number and understand where it came from.
Below, this is done end to end on the SKR trade, the same one this guide has been following. All values come from the two exchanges' own records. The numbers are illustrative: the market will be different by the time you read this, but the order of steps doesn't change.
Start with the statement, not the card
The exchange shows the result in two places, and those two places give different numbers.
| Balance delta | Closed-position card | Difference | |
|---|---|---|---|
| Binance | −14.73 | −14.72 | -0.01 |
| Bybit | +17.46 | +17.44 | +0.02 |
| Total | +2.73 | +2.72 | +0.01 |
The balance delta is simply “how much was in the account before the trade” minus “how much is there after”. It doesn't have to match the card: the card describes the position, while the statement describes the account. The trade's result is the balance delta; the card is only a breakdown.
In this trade, about $0.01 couldn't be tied to any transaction; most likely, the starting balances weren't exactly round. The amount is small, and it's visible only because the journal has a reconciliation row. Without such a row, remainders like this quietly dissolve into the result, and next time it won't necessarily be cents.
Split each leg into three parts
Every leg has exactly three sources of result, and each one comes from its own place:
| Part | Where it comes from | Formula |
|---|---|---|
| Price result | Order history: quantity and average prices | long: qty × (exit price − entry price); short: qty × (entry price − exit price) |
| Funding | Transaction log, type Funding | Sum of all funding accruals over the holding period |
| Fees | Order history, entry and exit fees | Sum over both fills |
For SKR, this gave:
| Part | Binance (LONG) | Bybit (SHORT) | Total |
|---|---|---|---|
| Price | −18.6386 | +19.2176 | +0.579 |
| Funding | +4.20 | −1.38695 | +2.813 |
| Fees | −0.29 | −0.38869 | −0.679 |
| Whole leg | −14.729 | +17.442 | +2.713 |
Take the funding sign from the log, not from memory: the long leg on Binance received, and the short leg on Bybit paid. Both rates were negative.
Price side
A spread trade earns on the difference between two gaps: the one there at opening and the one left at closing. You calculate it on the matched quantity of coins, that is, the smaller of the two.
| Moment | Gap per coin | On 12,610 coins |
|---|---|---|
| Entry | 0.023785 − 0.0235737 = 0.0002113 | +$2.66 |
| Exit | 0.022261 − 0.0221041 = 0.0001569 | −$1.98 |
| Convergence | 0.0000544 | +$0.69 |
The trade closed 0.69 / 2.66 = 25.7% of the gap that was there at entry.
The remaining 73 coins (the difference between 12,683 in the long and 12,610 in the short) had nothing to do with the spread at all: they went through the −6.23% price move as an ordinary directional position and cost −$0.11. The total price result: 0.69 − 0.11 = +$0.58.
Entry and exit percentages can't be subtracted from each other. The entry gap of +0.896% and the exit gap of 0.710% are calculated from different prices: between them, the token fell 6.2%, so the same percentage at exit is worth less money than at entry. Calculate in the account currency and derive percentages from money, not the other way around.
Funding side
Funding spread on the card is an annualized rate at the moment you read it. Comparing it with the actual result shows what it is and what it isn't:
| Leg | Quoted before entry | Realized over 11 h 43 min |
|---|---|---|
Binance LONG | +794.2% | +1,050.6% |
Bybit SHORT | +10.9% | −345.8% |
| Pair | +805.15% | +704.8% |
The pair delivered 87.5% of the quoted carry, but the composition of the result changed completely. The long leg beat its quote because the rate on Binance went even deeper into negative territory. The short leg flipped: it went in as a receiver and paid $1.39 over the holding period, hour after hour, until the rate came back in the last hour.
This tells you how to read the card: Funding spread answers “how much is being paid right now”, not “how much will be paid over the holding period”. The second question is answered by Consistency and Stability on Live Spreads: the share of hours with positive carry and how steady its size is.
Execution cost
A full round trip is four fills, and each one is charged at its own rate.
| Leg | Entry | Exit | Total |
|---|---|---|---|
Binance | 0.29 combined | 0.29 | |
Bybit | 0.10797 (limit, 0.036%) | 0.28071 (market, 0.100%) | 0.38869 |
| Total | 0.679 = 0.227% of leg notional |
This is exactly what Execution and Round-trip cost leave out: both are gross. You can check the consequence on the most telling number in this guide. The carry ran at 0.24 USDT per hour, so the 0.679 in fees took 2 hours 50 minutes to earn back. The platform quoted Break Even at 28 minutes. The real payback turned out six times longer than quoted, and still four times shorter than the holding period.
Normalize by time and capital
| Metric | Value | How it's derived |
|---|---|---|
| Holding period | 11 h 42 min 47 s = 11.7131 h | Close − open |
| Deployed capital | $200.00 | Sum of the deposits on both exchanges |
| Result | +$3.01 | Sum of the balance deltas |
| Return | +1.505% | 3.01 / 200 |
| Annualization factor | ×747.89 | 8760 h / 11.7131 h |
| APR | ≈ +1,126% | 1.505% × 747.89 |
Annualization scales a short-term result to a full year: “if it went like this all the time”. 8760 is the number of hours in a year. APR here is a simple scaling of one observation to a year, with no reinvestment. Eleven hours stretched over a year mechanically produce a four-digit number, and it says nothing about whether such a result will repeat. It's a way to compare two trades of different lengths with each other, not a forecast.
The denominator changes the headline figure threefold, so name it explicitly:
| Calculation base | Return | APR |
|---|---|---|
| Deployed capital, $200.00 | +1.505% | ≈ +1,126% |
| Margin used, $59.89 | +5.03% | ≈ +3,759% |
| Combined notional of both legs, $598.92 | +0.503% | ≈ +376% |
All three are correct. The first is the baseline, because the free balance in the accounts isn't idle: it's the buffer that keeps the legs alive when the market moves against the position. A return calculated on margin alone describes a strategy without a buffer, which is not the one that was traded.
Trade summary
| Value | Share of result | |
|---|---|---|
| Spread convergence | +$0.69 | +23% |
| Leg mismatch (73 SKR) | −$0.11 | −4% |
| Net funding | +$2.81 | +93% |
| Fees | −$0.68 | −23% |
| Documented from exchange records | +$2.71 | |
| Result from account balances | +$3.01 | 100% |
The trade was closing two gaps at once and lived off funding: the carry delivered four times more than the entire price result. The price side still worked as intended (25.7% of the entry gap); it was simply the smaller part of the thesis.
Trade journal
Half of the fields needed for the calculation above exist only at the moment of the trade. Card quotes are live and different an hour later; Break Even in the row is recalculated continuously; the entry fee is visible in the order history, but after the fact there's nothing left to link it to the decision that produced it. You keep a journal not for the sake of discipline, but because without one the review is impossible.
The format below is the minimum: you can't remove anything from it without losing one of the rows of the calculation. It's filled in with the SKR trade.
Block 1: before entry, from the platform
| Field | SKR |
|---|---|
| Time the pair was read, UTC | 2026-09-01 21:24:55 |
Share link | spreadlabs.io/pair-analysis?token=SKR&long=binance&short=bybit |
Depth | $1k |
Funding spread | +805.15% |
Entry · top of book | +0.879% |
Exit · top of book | −0.922% |
Round-trip cost | −0.043% |
Break Even / Intervals to B/E | ≈ 28 min / 1 |
| Funding interval of the legs | Binance 1h · Bybit 1h · schedule-aligned |
Volume 24h long / short | $354.5M / $85.6M |
Open interest long / short | $13.6M / $8.5M |
Target Exit Spread level | not recorded |
| Risk exit condition | not recorded |
The last two rows are empty in this trade, and you can see that only thanks to the journal. These are exactly the rows you fill in before entry: without them, the decision to close was made on the fly rather than by plan, and there's nothing to check it against after the fact.
Block 2: at execution
| Field | Binance LONG | Bybit SHORT |
|---|---|---|
| Entry time, UTC | 00:26:41 | 00:26:13 |
| Order type | – | Limit |
| Quantity | 12,683 SKR | 12,610 SKR |
| Average entry price | 0.0235737 | 0.023785 |
| Entry notional | $298.99 | $299.93 |
| Entry fee | 0.29 combined for the round trip | 0.10797 |
| Leverage / margin | 10x cross / $29.90 | 10x / $29.99 |
| Balance before | 100.00 | 100.30 |
The quantity row is where the 73-coin mismatch shows up. At entry, it takes one second of attention and eliminates a 15% loss on the price side.
Block 3: after closing
| Field | Binance LONG | Bybit SHORT |
|---|---|---|
| Exit time, UTC | 12:09:28 | 12:09:28 |
| Order type | – | Market, 4 fills |
| Average exit price | 0.0221041 | 0.022261 |
| Exit fee | Included in 0.29 | 0.28071 |
| Funding for the trade | +4.20 | −1.38695 |
| Balance after | 85.25 | 117.76 |
Block 4: calculation
| Metric | Formula | SKR |
|---|---|---|
| Price result, long | qty × (exit − entry) | −18.6386 |
| Price result, short | qty × (entry − exit) | +19.2176 |
| Spread convergence | matched qty × [(entry_short − entry_long) − (exit_short − exit_long)] | +0.686 |
| Mismatch cost | qty difference × (exit − entry) on the larger leg | −0.107 |
| Share of the gap closed | convergence / entry gap | 25.7% |
| Leg result | price + funding − fees | −14.729 / +17.442 |
| Holding period | close − open | 11.7131 h |
| Trade result | sum of balance deltas | +3.01 |
| Return | result / deployed capital | +1.505% |
| APR | return × 8760 / period in hours | ≈ +1,126% |
| Funding APR per leg | funding / notional × 8760 / period | +1,050.6% / −345.8% |
Block 5: reconciliation — the journal isn't closed without it
| Check | SKR |
|---|---|
| Sum of leg results | +2.713 |
| Sum of balance deltas | +3.010 |
| Discrepancy | +0.297 |
Record the discrepancy; don't adjust it away. Zero means every component has been found; anything else means some account movement stayed outside the analysis, and a row that says so is more honest than a table that balances.
Three fields are worth keeping separately and updating once a quarter rather than once per trade: your own maker and taker rates on each exchange, each exchange's funding interval, and the deposit and withdrawal time between them. They rarely change, but they go into every Break Even calculation.
The journal is bookkeeping, not performance reporting. It exists so that your next trade is calculated from this trade's actual costs, not from the quotes it saw.
When the spread doesn't converge
A gap can widen instead of narrowing. The position stays hedged on direction (the token can go anywhere), but closing becomes more expensive than it was at entry.
You'll see this in three places, all of them already familiar: Exit Spread in the row has become worse than at entry; Execution has widened; on the Price spread chart, the entry and exit lines are moving apart instead of coming together.
Only carry lets you wait. As long as Funding spread is positive, time works for the position: each funding interval brings an accrual that covers part of the round-trip cost. That's exactly what Break Even and Intervals to B/E measure. A dash in them is a direct answer: you can't wait at someone else's expense, and the whole result has to come from the gap narrowing.
Sometimes there's nothing to converge to. A gap may be not a deviation but the pair's normal state:
| Cause | How it looks on the platform |
|---|---|
| A persistent premium on one exchange | Spread distribution shows that the wide level is the usual one, and Spread %ile sits in the middle, not at the edge |
| Different funding regimes on the two exchanges | The legs' rates diverge systematically; Consistency is high while APR Long / APR Short stay persistently different |
| The thin leg drifts on its own | Low Volume 24h and Open interest on the smaller leg: the price there follows rather than leads |
| The instrument gets halted | Delisting, or a suspension of trading or withdrawals on one of the exchanges |
Spread distribution and Spread %ile answer this question better than anything else: if the current “wide” spread is the pair's usual level, there's no basis for expecting convergence.
There are three outcomes, and luck isn't what separates them. The gap returned to its usual level. The gap didn't return, but the carry covered the wait. Neither happened, and then you paid for the wait twice: with a wider exit and with time during which nothing accrued. The third outcome is fully described by the dash in Break Even that was visible before entry.
Waiting is never endless, and you're not the one who decides when it ends. Margin on the losing leg, liquidation of that leg, a delisting of the instrument, a withdrawal halt on an exchange: any of these closes the position at the prices available at that moment, not the ones you were waiting for.
This leads to a constructive takeaway, visible on SKR. That trade stood on two foundations at once: the gap could narrow, and the carry paid for the wait. The gap narrowed by 25.7% and the carry flipped on one leg, yet the position still closed in profit, because the second foundation held while the first was only partly working. A pair with a single foundation has no such margin.
Common mistakes
| Mistake | What it leads to | Where you can see it in advance |
|---|---|---|
| Comparing rows at the default depth but trading a larger size | Spreads and row order are calculated for a size other than the one that will fill | Depth in the toolbar, the effective lines on the Price spread chart |
| Matching legs by dollars instead of coin quantity | The remainder becomes a directional position: on SKR, 73 coins took 15% of the price result | The quantity row in both terminals |
Reading Entry Spread without Exit Spread | Half of the round-trip cost goes unaccounted for | Execution, the sum of both, in the same row |
Treating Δ APR, Execution and Round-trip cost as net | All three are gross; your own fees come on top | On SKR, fees of 0.227% of notional stretched the payback from 28 minutes to 2 h 50 min |
Taking Funding spread as a forecast | It's the rate at the moment you read it: on SKR, the pair delivered 87.5% of the quote, and the short leg flipped from receiving to paying | Consistency and Stability on Live Spreads |
| Ignoring the liquidity gap between the legs | The thin leg limits the size and absorbs the exit: for RED, volumes differed 850-fold | Volume 24h, Open interest, OI Diff, Volume Diff |
| Subtracting the exit percentage from the entry percentage | If the price has moved, they're calculated from different prices | Calculate in the account currency and derive percentages from money |
| Measuring return on the margin used | The free balance is a buffer, not idle capital; on SKR, the difference between the bases is threefold | The “deployed capital” row in the journal |
| Not writing down the target exit and the risk condition before entry | The decision to close is made on the fly and can't be checked afterward | Journal block 1 |
| Closing one leg and leaving the other open | That's not half a position but a full-size directional position | The open positions list on both exchanges |
| Taking the trade result from the closed-position card | The card describes the position, not the account | Balance delta, journal block 5 |
| Holding the position longer than its basis holds | A wider exit plus time without accruals | Funding spread, Funding APR per leg, Spread %ile |
Reference
The Live Spreads columns this guide uses. The full set of 27 columns and the definition of each one are on the Live Spreads page; in the interface itself, you can open any column's definition by hovering over its header.
| Column | Meaning |
|---|---|
Entry Spread | The price gap you cross when opening, at the size from Depth |
Exit Spread | The same gap for closing, at the same size |
Execution | Entry Spread plus Exit Spread: the full execution cost of a round trip |
Mark Spread | The difference between the two exchanges' mark prices (the mark price is the exchange's reference price, used to calculate profit and liquidation) |
Break Even | The holding period over which the funding carry covers Execution; a dash means it doesn't |
Intervals to B/E | The same, in the pair's funding intervals |
Δ APR | The annualized difference between the legs' funding rates, gross |
APR Long / APR Short | Each leg's rate separately |
Next Funding Long / Next Funding Short | Countdown to the next payment on each exchange |
Spread %ile | Where the current Entry Spread sits within the pair's own 30-day history |
Consistency | The share of hours over 30 days in which the pair paid positive net funding |
Stability | 0–100: how steadily the pair's funding level holds relative to all pairs |
Duration | How long the spread has held at its current level |
OI Sum / OI Diff | Total open interest of both legs and the gap between them, in % |
Volume Sum / Volume Diff | Total 24-hour volume and the gap between the legs, in % |
Pair Analysis cards and panels:
| Element | Meaning |
|---|---|
Funding spread | Annualized carry between the two legs at the moment you read it |
Entry · top of book | Cost of opening at the top of the book |
Exit · top of book | Cost of closing at the top of the book |
Round-trip cost | Entry plus exit: the full cost of a completed trade |
Price & volume | Ask, Bid, Open interest, Volume 24h for each leg |
Funding | Funding 1h, Funding 24h, Funding APR, Next funding for each leg |
Price spread | Four series: Entry · top, Exit · top and the same two adjusted for depth |
Spread distribution | Histogram of the entry spread with a marker at the current value |
Live Spreads toolbar controls:
| Control | What it does |
|---|---|
Table mode | Two column presets, Funding rate and Price; also switches the sort |
Columns | Show, hide and reorder columns, N / 27 shown |
Depth | The size at which Entry Spread and Exit Spread are quoted: $500 – $50,000 |
Exchanges | Exchange filter: one exchange shows every pair with a leg on it, two or more show only pairs between them |
Filters | Numeric ranges: Δ APR, OI Sum, Price Spread, OI Diff, Volume Sum, Only favorites |
Search ⌘K | Filtering by token and exchange |